NBA Performance Analysis
A Business Intelligence solution for sports analytics, transforming raw game statistics into actionable insights for data-driven decisions.
For details, check out the following project resources:
A Business Intelligence solution for sports analytics, transforming raw game statistics into actionable insights for data-driven decisions.
For details, check out the following project resources:
A Business Intelligence solution that could process raw NBA game statistics and transform them into actionable insights for player evaluation and team strategy optimization. The challenge was to create an analytical framework that supported multidimensional analysis while providing intuitive visualization for data-driven decision.
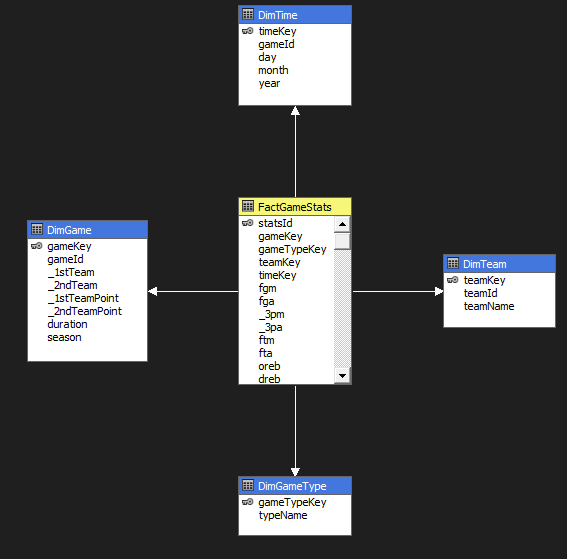
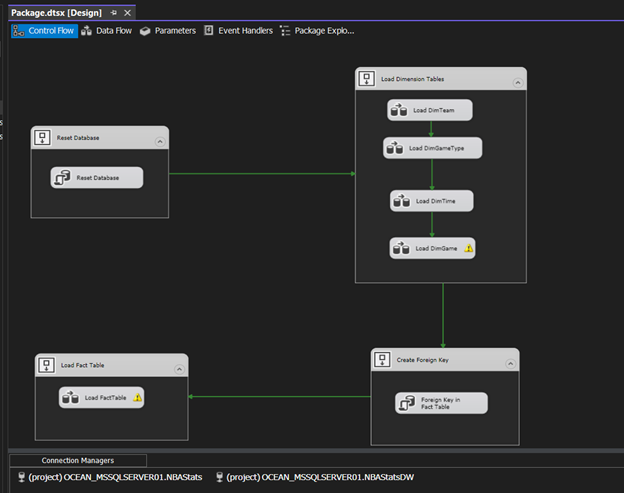
Data Model - SSIS Pipeline
Property Mapping Configuration

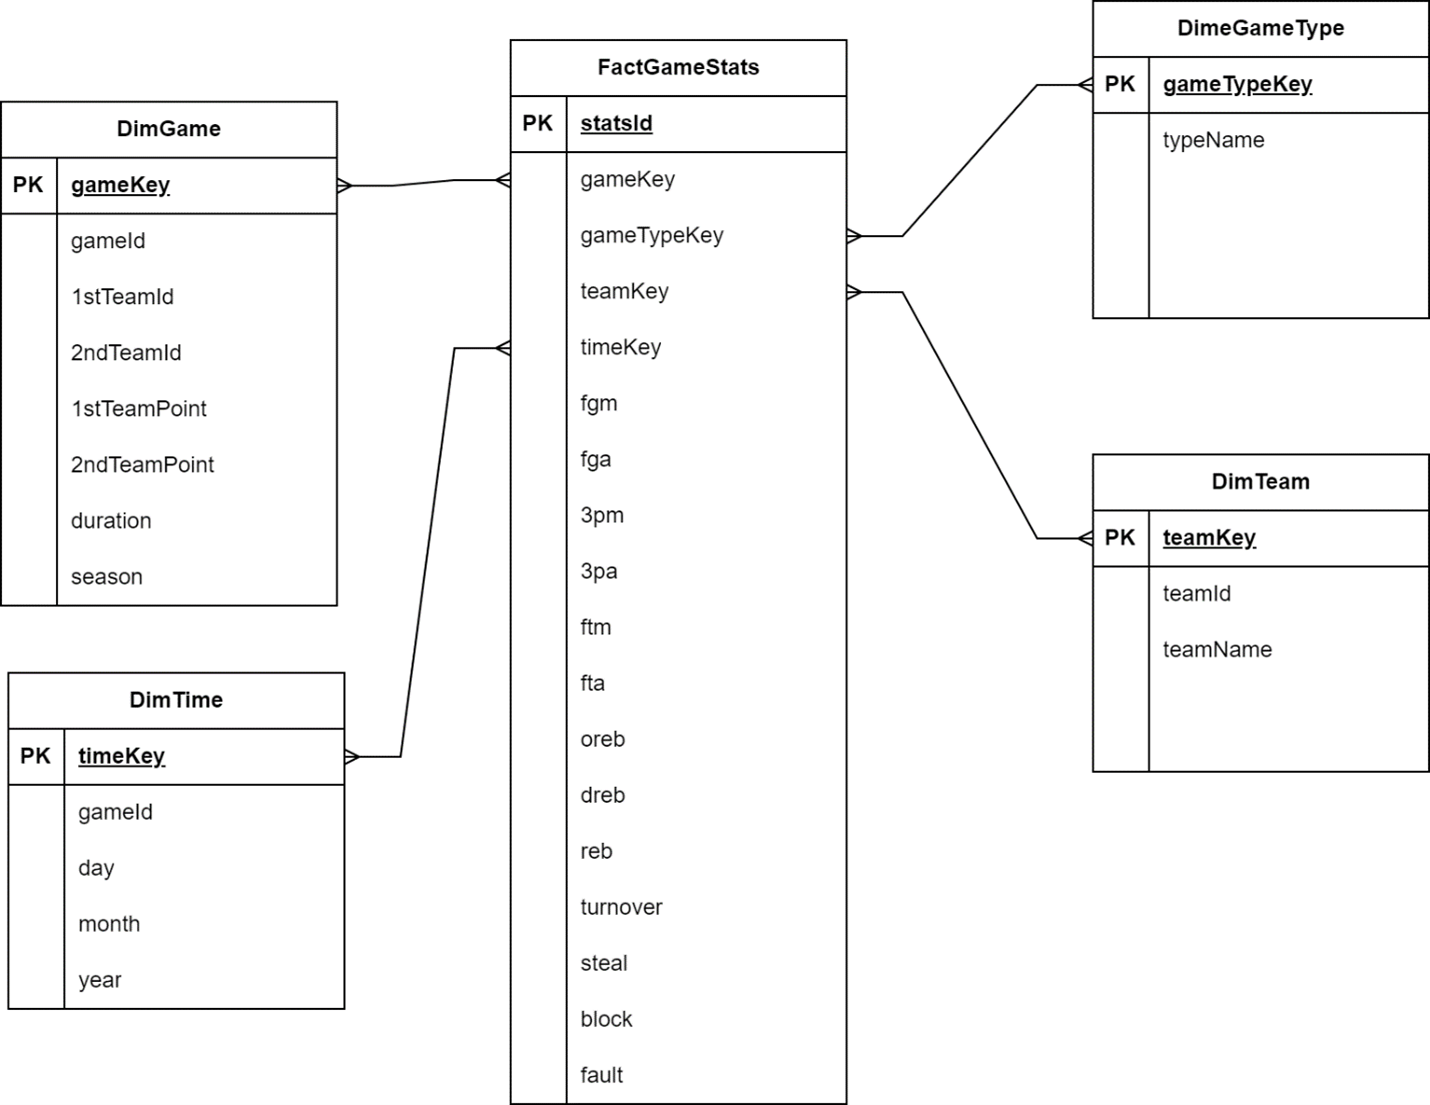
Star Schema Design
OLAP Cubes Implementation